See the Ojai Valley Highway 33 Multimodal and Community Enhancement Study Jan 2020 study to learn what assessments and measures were taken to guide this improvement/enhancement project.
The Oak View Half Mile study starts on page 4-10 and says:
OAK VIEW
Oak View has a larger commercial footprint than Casitas Springs and shows some effects of suburbanization with some buildings set back from the street and a wider section of Highway 33.
The recommendations for this village include:
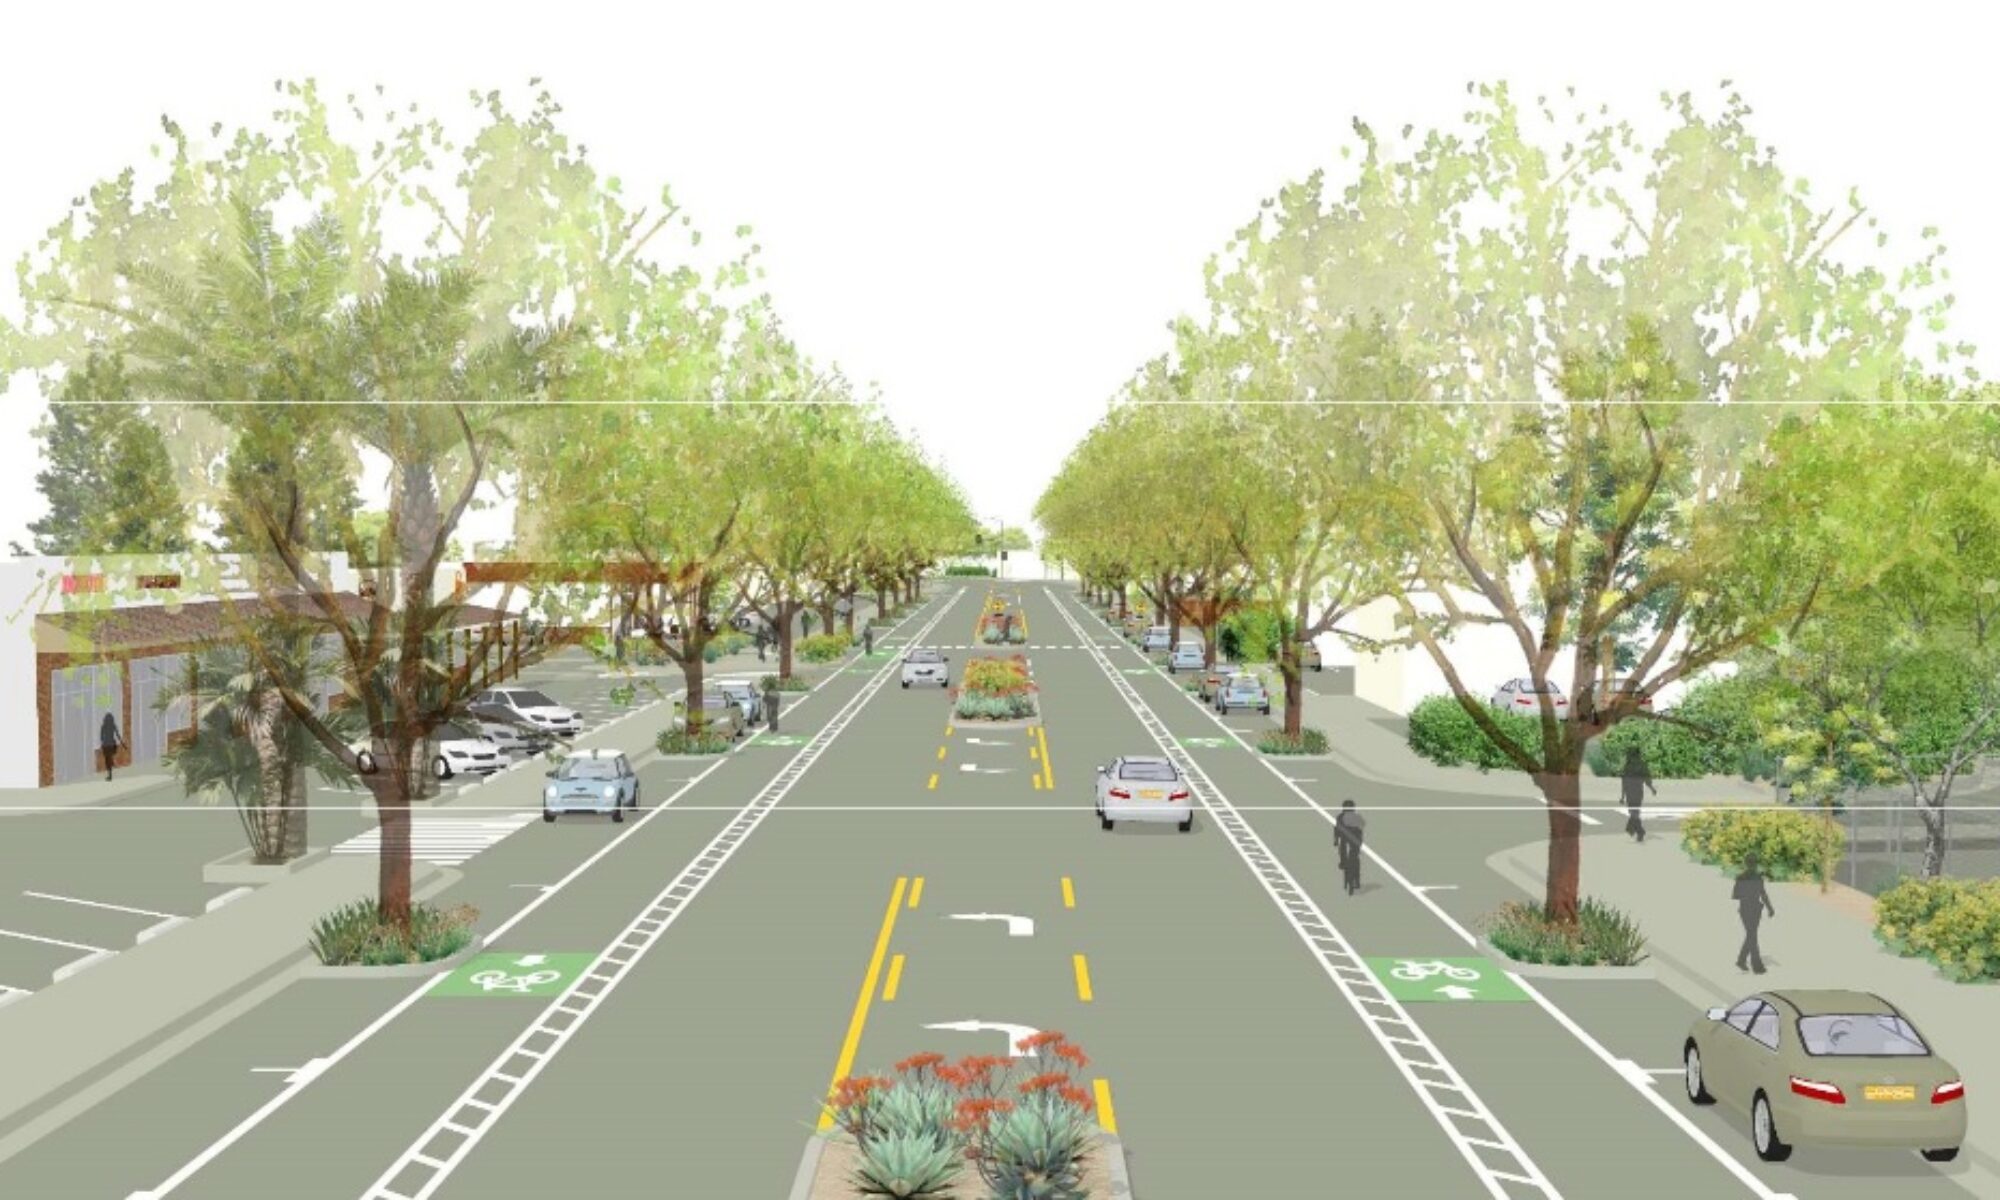
▪ Streetscape improvements including possible lane reductions (five to three), landscape, bike, and pedestrian improvements focused from Larmier Avenue to Santa Ana Boulevard.
▪ Gateway design considerations at Larmier Ave and Oak View Road, which may include features such as signage and landscaping.
The most substantial transportation recommendation included here is the reduction from five lanes to three. The daily traffic volumes of about 21,300 vehicles per day are within the range of volumes that are commonly considered for three-lane cross-sections. For reference, the FHWA Road Diet Informational Guide notes that road diets have been applied to streets exhibiting volumes up to 25,000 ADT.
(Click on images to enlarge.)
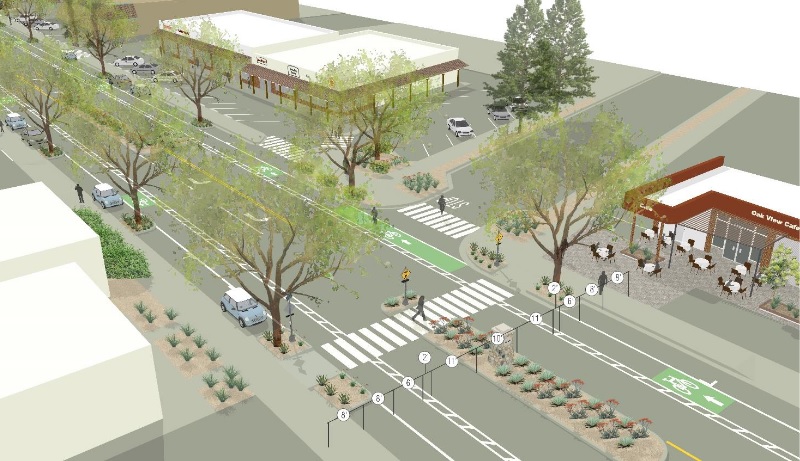 Many communities have found that with such conversions, the right-of-way can be reallocated for other uses, such as bicycle lanes or pedestrian facilities. Further, lane reductions reduce speeds by eliminating fast lanes and driver weaving. Often such projects result in greater lateral separation between pedestrian and vehicle traffic, which may make walking more comfortable. This increased walkability can also foster economic development, as it creates a destination wherere sidents and visitors can comfortably travel between destinations.
Road diets also clearly influence crash reduction. Converting a four- or five-lane street to a three-lane street reduces the conflicting streams of traffic and has been shown to reduce the number of collisions in most every case of implementation. The Federal Highway Administration has reported a 29% average reduction in crashes along corridors implementing a road -diet. Additional concerns are often raised due to necessary access by emergency vehicles. Typically designs gain support from local emergency responders prior to implementation, and features such as curbs that accommodate wider vehicle use are incorporated. It is anticipated that the roadway design will maintain 20’ of navigable space from curb to median to accommodate 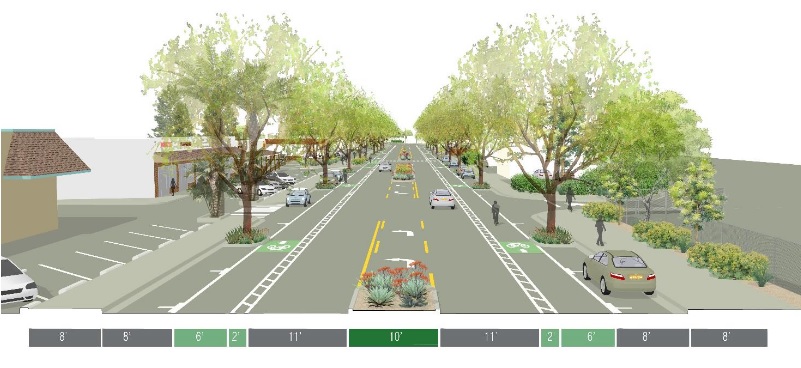 emergency vehicles. Features such as rounded curbs, and mountable medians (without planted trees) may be considered to facilitate use by larger emergency vehicles. Furthermore, the Ventura County Transportation Commission is currently undergoing a Transportation Emergency Preparedness Plan to better prepare regional responses to natural disasters. This study would evaluate all emergency egress patterns and alternatives, and may inform final design details for changes along Highway 33.
In the case of Oak View, the space gained via the lane reduction could be used to accommodate elements such as bike lanes and on-street parking.
Is a Road Diet in Oak View Viable?
As noted above, the traffic volumes observed on Highway 33 through Oak View are within range to consider the corridor a candidate for a road diet. To better understand the impacts of a road diet through Oak View, a travel time model was developed (using Synchro) for the corridor from a few hundred feet north of Santa Ana Boulevard and a few hundred feet south of Larmier Avenue.The model was run using peak turning count volume data (collected June 2018) and applying it to Synchro using two different methodologies:
▪ Synchro: Produces consistent output.
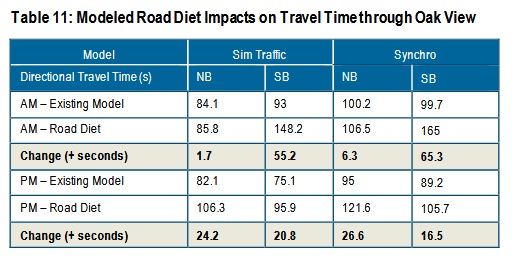
▪ Simtraffic: Produces slight variations every model run Based on these model runs, the most significant delays according to the model would be 65seconds in the southbound direction during peak volumes in the am, as seen in Table 11.
 (Click on image to enlarge.)
In the afternoons, delays are more significant in the northbound direction, but anticipated to be less than 30 seconds. These modeling efforts assumed traffic flowed at 35 mph during peak traffic hours.
Concerns were expressed that 35 mph, the posted speed limit, did not match the observed free flow speeds of 45 mph. While it is unlikely that peak traffic flows travel at 45 mph, the difference in traveling the length of the proposed road diet (0.5 miles) in free flow conditions assuming no stops are encountered, is 6 seconds in travel time. If vehicles during peak traffic conditions are traveling at 45 mph (unlikely), an additional 6 second delay to the above-mentioned delays could be expected. This variance between posted speed limits and observed free flow speeds were mentioned time and time again by residents throughout this planning process as a need to implement design strategies to bring speeds down to the speed limit, and create a safer environment for community members.
Lastly, as a road diet would be a roadway repurposing project, and is not adding lanes, the lane reconfiguration would not induce additional vehicle miles traveled (VMT). As such, this project would be compliant with revised California Environmental Quality Act (CEQA) guidelines to determine project impacts.
Full Synchro and Sim Traffic reports are included in the Appendix